Where you live in 2026 directly impacts the air you breathe. Some American cities enjoy crisp, clean air year-round. Others choke on pollution that threatens resident health daily.
The latest data reveals dramatic differences between America’s cleanest and most polluted cities. These gaps span from Hawaii’s ocean breezes to California’s smog-choked valleys. Understanding these rankings can help you protect your family’s health whether you live in a polluted metro or visit one.
How Cities Rank for Air Quality
Researchers measure city air quality using annual average PM2.5 concentrations. This fine particulate matter measures 2.5 micrometers or smaller.
These particles bypass your body’s natural defenses and embed deep in lung tissue.
The World Health Organization sets the gold standard at 5 µg/m³ annual average. The EPA recently tightened U.S. standards to 9 µg/m³.
Most cities fall somewhere between these benchmarks. Some blow past both limits entirely.
The 10 Best Large Cities for Clean Air in America 2026
These large US cities with populations over 100,000 boast the best air quality in the nation:
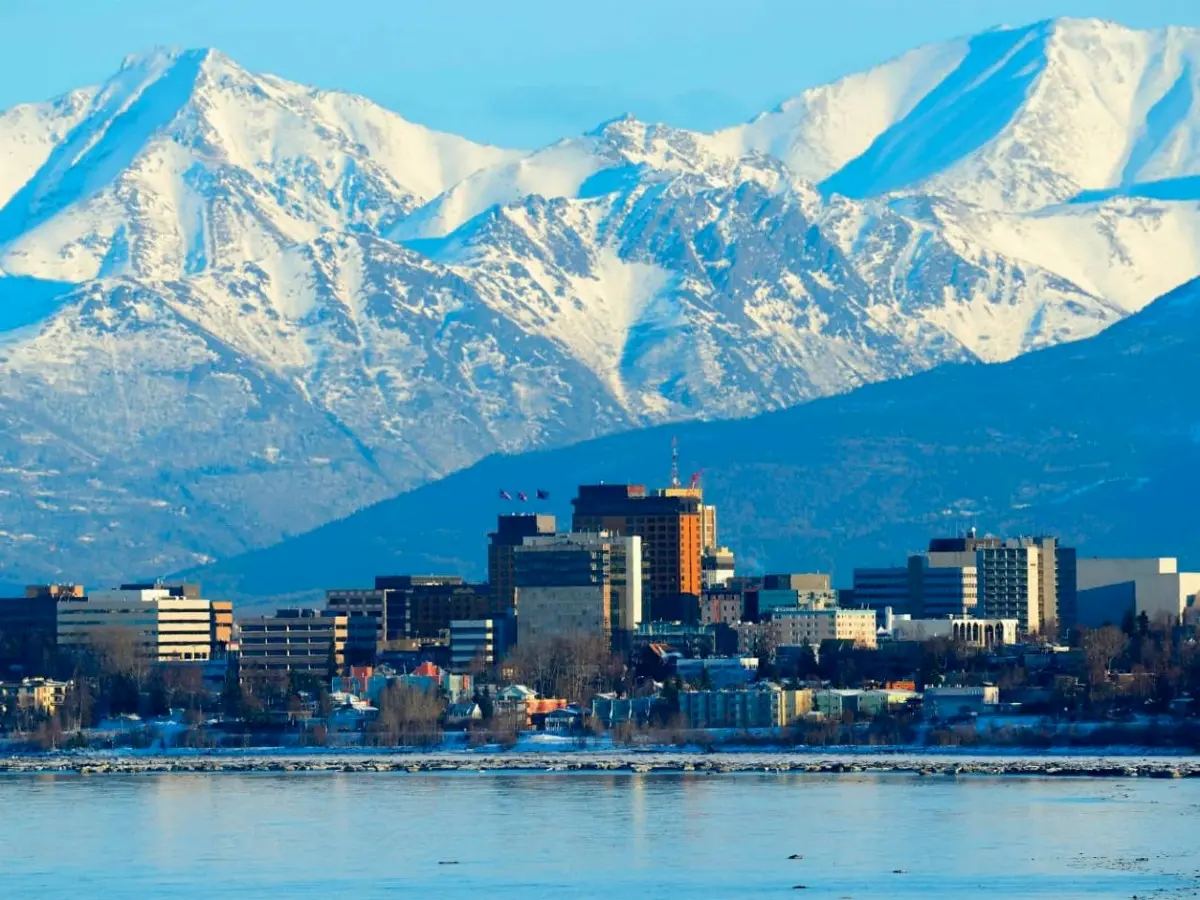
1. Anchorage, Alaska (3.1 µg/m³)
Alaska’s largest city enjoys the cleanest air of any major American city. Cold temperatures and sparse population keep pollution minimal. Mountain ranges block incoming pollution from other regions.
Local efforts to reduce emissions further protect air quality. Anchorage residents breathe air that meets WHO guidelines with room to spare.
2. Bellevue, Washington (3.5 µg/m³)
This Seattle suburb benefits from Pacific Ocean winds and strict environmental regulations. Tech industry dominance means fewer smokestack emissions than manufacturing cities.
3. Daly City, California (3.8 µg/m³)
Daly City represents California’s cleaner side. Located on the San Francisco peninsula, ocean breezes flush away pollutants. The city’s position shields it from Central Valley smog.
California actually appears on both best and worst lists. Geographic positioning matters as much as state boundaries.
4. West Jordan, Utah (3.9 µg/m³)
This Salt Lake City suburb escapes the inversion problems plaguing its larger neighbor. Higher elevation and favorable wind patterns keep air circulating.
5. San Mateo, California (4.0 µg/m³)
Another Bay Area city proves California can have clean air. San Mateo’s coastal location provides natural ventilation. Tech campuses replace heavy industry.
6. Santa Rosa, California (4.0 µg/m³)
North of San Francisco, Santa Rosa enjoys cleaner air than Southern California cities. Wine country geography creates favorable air flow patterns.
7. Honolulu, Hawaii (4.1 µg/m³)
Hawaii ranks among the cleanest states, and Honolulu leads the way. Trade winds constantly refresh the air. Rain scrubs pollutants from the atmosphere.
The American Lung Association gave Honolulu zero unhealthy ozone days. The city ranks among the nation’s cleanest for all pollution measures.
8. Seattle, Washington (4.1 µg/m³)
Seattle’s rainy reputation helps air quality. Precipitation washes particles from the air. The Pacific Ocean provides constant fresh air circulation.
9. Berkeley, California (4.2 µg/m³)
This university town combines coastal location with environmental consciousness. Strict local regulations limit industrial emissions.
10. San Francisco, California (4.2 µg/m³)
San Francisco completes the clean air paradox. Despite California’s overall poor ranking, the Bay Area hosts multiple cleanest cities. Ocean winds and hills create natural air purification.
The 10 Most Polluted Large Cities in America
These cities with populations over 100,000 suffer the worst air quality:
1. Ontario, California (14.3 µg/m³)
Ontario anchors the Inland Empire’s pollution problems. The city sits east of Los Angeles where smog accumulates. Warehouse and shipping traffic generate massive diesel emissions.
Mountain ranges trap pollutants against the city. Summer heat cooks these emissions into dangerous ozone levels. Ontario’s air quality exceeds WHO guidelines by nearly triple.
2. Orange, California (13.6 µg/m³)
Adjacent to Ontario, Orange faces identical geographic challenges. The Santa Ana Mountains block westward air flow. Pollution from the entire LA basin drifts east and stagnates.
3. San Bernardino, California (12.9 µg/m³)
San Bernardino anchors the worst metro area for air quality nationwide. The city ranks first for ozone pollution and high particle pollution days. The 2025 State of the Air report identified San Bernardino-Riverside as the most polluted metro area in America.
4. Fontana, California (12.7 µg/m³)
Fontana’s massive auto racing speedway and industrial facilities add local emissions to regional smog. The city exemplifies how inland California geography concentrates pollution.
5. Visalia, California (12.5 µg/m³)
Visalia sits in the San Joaquin Valley, California’s agricultural heartland. Pesticide spraying, dust, and vehicle emissions combine in this trapped basin.
6. Nampa, Idaho (11.7 µg/m³)
Nampa breaks California’s monopoly on worst air quality. Agricultural burning and dust from surrounding farmland drive high PM2.5 levels. Winter inversions trap cold air and pollutants close to the ground.
7. West Covina, California (11.6 µg/m³)
Another LA suburb, West Covina suffers from regional smog transported eastward. The San Gabriel Mountains block pollution escape routes.
8. Pomona, California (11.1 µg/m³)
Pomona’s location at the eastern edge of Los Angeles County places it downwind of the entire metro area’s emissions. The city hosts heavy industry and major freeways.
9. Pasadena, California (11.0 µg/m³)
Pasadena’s reputation for beautiful weather masks serious air quality problems. The city sits in a pollution corridor between mountains and the LA basin.
10. Riverside, California (10.9 µg/m³)
Riverside completes the Inland Empire’s dominance of worst air quality. The metro area leads the nation in ozone pollution days. Over 4 million residents breathe air that fails all federal standards.
Clean Air Small Town Winners and Losers
Looking beyond large cities reveals even more dramatic extremes. Small towns under 100,000 population show the widest air quality gaps.
Cleanest Small Town: Waimea, Hawaii (1.7 µg/m³)
Waimea on Hawaii’s Big Island boasts the cleanest air of any U.S. town over 10,000 population. The reading of 1.7 µg/m³ beats the WHO guideline by nearly triple margin.
Trade winds and isolation from industrial sources create this pristine environment. Waimea is what American air quality looked like before industrialization.
Other Clean Small Towns
- Troutdale, Oregon (2.5 µg/m³) – Columbia River Gorge winds flush pollutants away
- Seaside, California (2.5 µg/m³) – Monterey Bay location provides ocean air circulation
- Mason, Washington (2.7 µg/m³) – Olympic Peninsula isolation protects air quality
- North Kingstown, Rhode Island (2.8 µg/m³) – Coastal location and low industrial activity
Worst Small Town: Shafter, California (16.1 µg/m³)
Shafter, a Central Valley agricultural town, suffers the worst air quality of any small American city. Dust from farming operations combines with vehicle emissions from Highway 99.
The town earned designation as “at special risk of dust impacts” from harvesting. Local farmers receive subsidies for low-pollution equipment, but change comes slowly.
Other Polluted Small Towns
- Mission, Texas (12.4 µg/m³) – Border location receives pollution from Mexican industry
- Huntington, West Virginia (7.5 µg/m³) – Coal country industrial legacy
- Gulfport, Mississippi (7.6 µg/m³) – Port traffic and industrial emissions
Why Geography Creates Such Extreme Differences
City air quality depends on three primary factors:
- Emission sources include vehicles, factories, and power plants. Cities with heavy industry and sprawl generate more pollution.
- Geographic traps like valleys and basins hold pollutants in place. California’s Central Valley and mountain-ringed cities suffer most from this effect.
- Climate and weather patterns either disperse or concentrate pollution. Inversions, heat, and stagnant air worsen pollution. Wind and rain improve it.
The American Lung Association found that 156 million Americans live in counties with failing air quality grades. That represents 46% of the population.
Protection in Polluted Cities
Living in a high-pollution city requires proactive measures. At Salas HVAC, we recommend these strategies for our Arizona customers and anyone in polluted areas:
Create Clean Indoor Air
Your home can provide refuge from outdoor pollution. Air purifiers with true HEPA filtration capture PM2.5 particles. Place units in bedrooms where you spend eight hours nightly.
Keep windows closed on high-pollution days. Use your HVAC system with high-quality filters. Running your AC without a filter actually worsens indoor air quality by circulating outdoor pollutants.
Monitor Air Quality Daily
Check the Air Quality Index before outdoor activities. Many weather apps now include AQI readings. Avoid exercise outdoors when AQI exceeds 100.
Schedule outdoor activities for early morning when pollution levels are lowest. Avoid rush hour traffic exposure when possible.
Consider Relocation Strategically
If you have respiratory conditions, consider air quality in relocation decisions. The data shows dramatic differences even within the same state. California hosts both the cleanest and most polluted cities.
At Salas HVAC, we help families evaluate indoor air quality solutions regardless of their location. Whether you need odor control or virus protection, proper filtration makes a measurable difference.
FAQs
What city has the cleanest air in America?
Anchorage, Alaska boasts the cleanest air of any major U.S. city, averaging 3.1 µg/m³ of PM2.5. For smaller towns, Waimea, Hawaii leads with just 1.7 µg/m³.
What city has the worst air quality in America?
Ontario, California suffers the worst air quality of any large city, averaging 14.3 µg/m³ of PM2.5. For small towns, Shafter, California ranks worst at 16.1 µg/m³.
Why are California cities both the cleanest and most polluted?
California’s geography creates extreme variation. Coastal cities like San Francisco and Daly City enjoy ocean winds that scrub the air clean. Inland valleys like the Central Valley trap pollutants between mountain ranges. This creates pockets of both pristine and dangerous air quality.
How can I check my city’s air quality?
The EPA’s AirNow website provides real-time air quality data for every U.S. city. Many weather apps and websites also display Air Quality Index readings. IQAir offers global air quality rankings and historical data.
Do air purifiers really help in polluted cities?
Yes. Quality air purifiers with HEPA filters reduce indoor PM2.5 levels by 80-90% even when outdoor air is heavily polluted. They provide essential protection for families in high-pollution areas.
What health problems does city air pollution cause?
PM2.5 particles cause asthma attacks, heart attacks, strokes, and lung cancer. Long-term exposure reduces lung function and shortens lifespans. Children, elderly adults, and people with existing conditions face the highest risks.
Final Thoughts
Even in the most polluted cities, you can protect your family. Indoor air quality matters as much as outdoor conditions. Proper air filtration and monitoring can create safe indoor spaces even within unhealthy regions.
If you have questions about your home’s air quality, reach out any time.
Breathe easy,
Michael
Sources
American Lung Association. (2025, April 23). State of the Air 2025.
https://www.lung.org/media/press-releases/state-of-the-air-2025
IQAir. (2025). 2024 World Air Quality Report.
https://www.iqair.com/world-air-quality-report
Lung.org. (2025). Cleanest Cities | State of the Air.
https://www.lung.org/research/sota/city-rankings/cleanest-cities
USA Today. (2025, April 23). Tens of millions more Americans are breathing polluted air.
https://www.usatoday.com/story/news/nation/2025/04/23/worst-and-best-places-for-air-quality-in-us/83237171007/
World Health Organization. (2021). WHO Global Air Quality Guidelines.
https://www.who.int/publications/i/item/9789240034228