Welcome to our comprehensive guide on indoor air quality statistics, filled with insights.
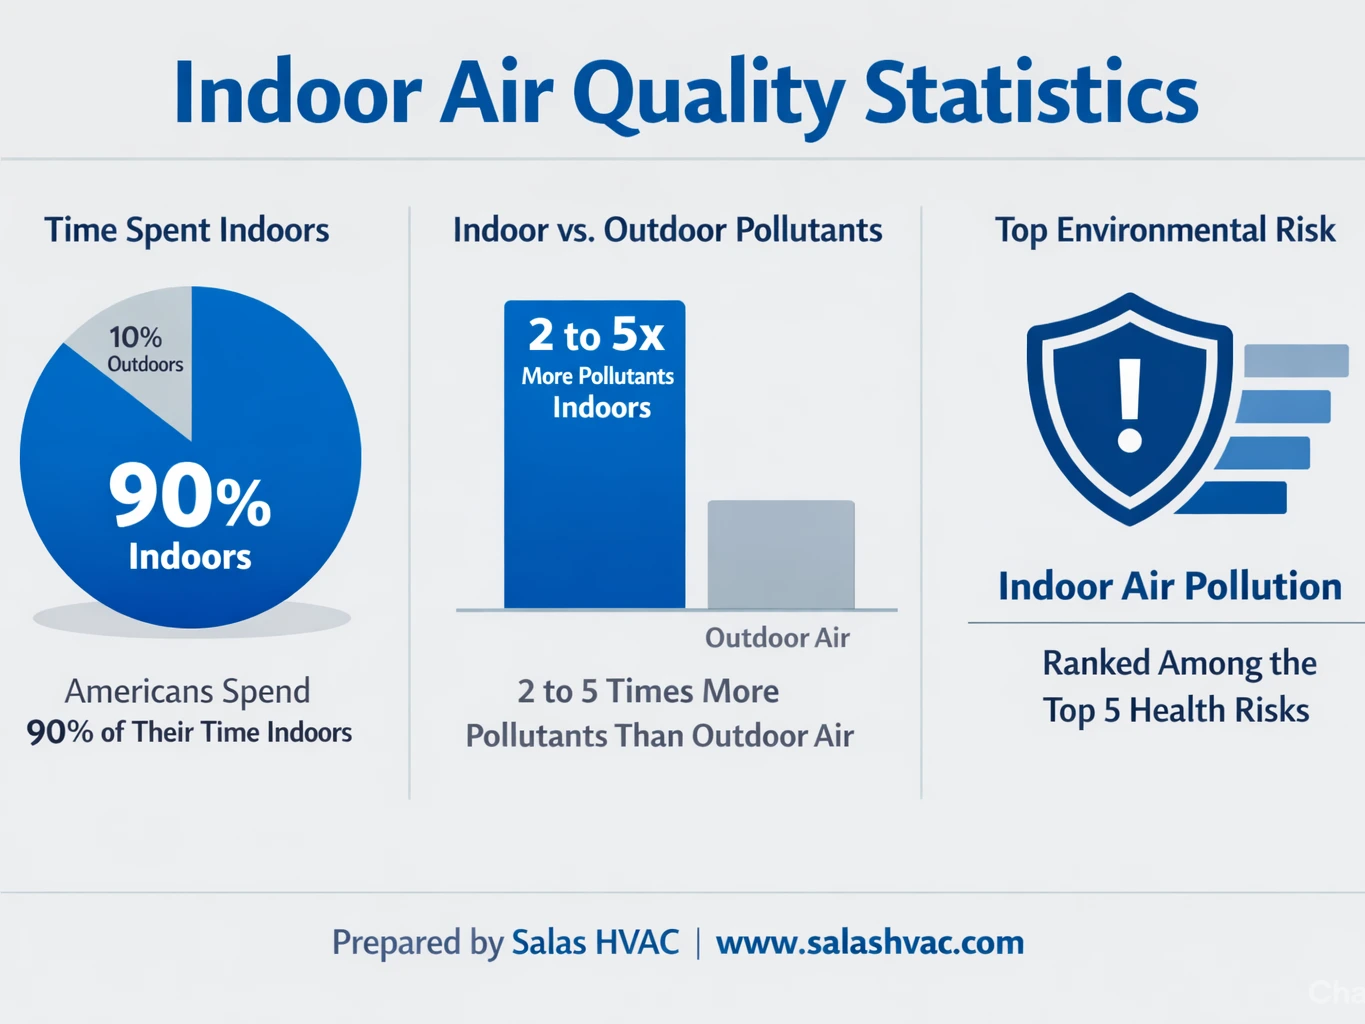
Did you know that Americans spend approximately 90% of their time indoors? Or that the air inside your home could be 5 times more polluted than outdoor air?
This guide breaks down the most critical indoor air quality statistics. You will learn what the data means for your family’s health and which solutions actually work.
1. Americans Spend 90% of Their Time Indoors
The EPA tracks exposure patterns across the United States. Their data reveals a startling truth about modern life.
Americans spend roughly 90% of their time inside buildings. This includes homes, offices, schools, and vehicles. People most sensitive to air pollution including young children, elderly adults, those with heart or lung conditions spend even more time indoors.
This statistic matters because indoor pollutant concentrations often exceed outdoor levels. The more time you spend inside, the greater your exposure to potential contaminants.
Source: Indoor Air Quality, U.S. EPA
2. Indoor Air Contains 2 to 5 Times More Pollutants Than Outdoor Air
Many homeowners assume outdoor air poses the biggest threat. Research proves the opposite.
Indoor air contains 2 to 5 times higher concentrations of some pollutants than typical outdoor air. During certain activities like paint stripping, indoor levels can spike to 1,000 times background outdoor levels.
Modern building practices contribute to this problem. Energy-efficient construction reduces air exchange rates. Without proper mechanical ventilation, pollutants accumulate inside your home.
Source: Volatile Organic Compounds’ Impact on Indoor Air Quality, U.S. EPA
3. EPA Ranks Indoor Air Pollution Among Top Five Environmental Risks
The EPA Science Advisory Board conducts comparative risk studies. Their findings place indoor air quality among the most serious health threats.
EPA consistently ranks indoor air pollution among the top five environmental risks to public health. This ranking reflects both the severity of health impacts and the widespread nature of exposure.
This risk assessment drives regulatory attention and public health recommendations. It signals that indoor air deserves the same concern as outdoor smog or water contamination.
Source: Why Indoor Air Quality is Important to Schools, U.S. EPA
4. Household Air Pollution Causes 2.9 Million Deaths Annually Worldwide
Worldwide data paints a sobering picture of indoor air quality impacts.
Household air pollution causes an estimated 2.9 million premature deaths annually. Key facts include:
- Over 309,000 deaths of children under age 5
- Combined household and ambient air pollution cause 6.7 million premature deaths each year
- Deaths stem from stroke, heart disease, chronic obstructive pulmonary disease (COPD), and lung cancer
- In poorly ventilated homes, indoor smoke reaches fine particle levels 100 times higher than acceptable standards
Source: Household Air Pollution and Health, World Health Organization
5. Radon Causes 14,000 Lung Cancer Deaths Per Year in the U.S.
Radon represents one of the most dangerous indoor pollutants. You cannot see, smell, or taste this radioactive gas.
Radon causes approximately 14,000 lung cancer deaths per year in the United States. This makes it the second leading cause of lung cancer after smoking. Smokers exposed to high radon levels face dramatically increased risks.
Any home can have a radon problem. New homes, old homes, sealed homes, and drafty homes all face potential risks. Testing remains the only way to know your home’s radon level.
Source: The Inside Story: A Guide to Indoor Air Quality, U.S. CPSC/EPA
6. Nearly 1 in 13 School-Age Children Has Asthma
Nearly 1 in 13 school-age children has asthma. This condition causes more school absences than any other chronic illness.
Indoor allergens trigger asthma symptoms in sensitive children:
- Dust mites
- Mold
- Pet dander
- Cockroach allergens
These allergens concentrate inside buildings. Exposure to diesel exhaust from school buses worsens both asthma and allergies. Installing proper air purification helps remove these triggers from your home environment.
Source: Why Indoor Air Quality is Important to Schools, U.S. EPA
7. VOC Levels Average 2 to 5 Times Higher Inside Homes
Volatile organic compounds (VOCs) evaporate from thousands of household products. These chemicals create serious health risks.
EPA TEAM studies found levels of common organic pollutants average 2 to 5 times higher inside homes than outside. This holds true regardless of whether homes sit in rural or highly industrial areas.
Sources include:
- Paints and varnishes
- Cleaning supplies
- Pesticides
- Dry-cleaned clothing
- Stored fuels and hobby supplies
Source: Volatile Organic Compounds’ Impact on Indoor Air Quality, U.S. EPA
8. CO Levels Near Gas Stoves Can Reach 30+ PPM
Carbon monoxide (CO) causes immediate poisoning and long-term health damage. This odorless gas comes from combustion sources.
Average CO levels in homes without gas stoves range from 0.5 to 5 parts per million (ppm). Levels near poorly adjusted gas stoves can reach 30 ppm or higher. Short-term exposure to elevated CO levels can be lethal.
Every home needs working CO detectors. Annual HVAC system inspections also prevent dangerous leaks from furnaces and water heaters.
Source: The Inside Story: A Guide to Indoor Air Quality, U.S. CPSC/EPA
9. Secondhand Smoke Causes 3,000 Lung Cancer Deaths Yearly
Environmental tobacco smoke contains over 4,000 compounds. More than 40 of these cause cancer in humans or animals.
EPA estimates exposure to secondhand smoke causes approximately 3,000 lung cancer deaths annually in nonsmoking adults. Additional impacts include:
- 150,000 to 300,000 lower respiratory tract infections in infants and children under 18 months
- 7,500 to 15,000 hospitalizations each year
- Increased asthma episodes in hundreds of thousands of children annually
Source: The Inside Story: A Guide to Indoor Air Quality, U.S. CPSC/EPA
10. Indoor Dust Mite Levels Consistently Exceed Outdoor Levels
Biological contaminants thrive in indoor environments. These include mold, bacteria, viruses, pollen, and pet dander.
Indoor levels of dust mites consistently exceed outdoor levels. Conversely, indoor levels of pollen and fungi typically remain lower than outdoors (except where indoor moisture creates fungal growth).
Maintaining humidity between 30-50% helps control biological growth. Dehumidifiers play a critical role in moisture management, especially in humid climates or during Arizona monsoon season.
Source: The Inside Story: A Guide to Indoor Air Quality, U.S. CPSC/EPA
11. Formaldehyde Above 0.1 PPM Causes Burning and Breathing Difficulty
Pressed wood products release formaldehyde gas. This colorless chemical causes both immediate symptoms and long-term cancer risks.
Formaldehyde exposure above 0.1 parts per million causes watery eyes, burning sensations in eyes and throat, nausea, and breathing difficulty. High concentrations trigger asthma attacks. The chemical causes cancer in animals and may cause cancer in humans.
Newer homes with significant pressed wood products often show higher formaldehyde levels. Emissions decrease as products age, but ventilation remains essential.
Source: The Inside Story: A Guide to Indoor Air Quality, U.S. CPSC/EPA
12. Fireplaces and Woodstoves Dramatically Increase Indoor Particle Levels
Microscopic particles penetrate deep into lung tissue. These particles come from combustion sources and indoor activities.
Particle levels in homes without smoking or strong particle sources match or fall below outdoor levels. However, fireplaces, woodstoves, kerosene heaters, and environmental tobacco smoke dramatically increase indoor concentrations.
Fine particles (PM2.5) pose the greatest health risks. They carry toxins deep into the respiratory system and bloodstream.
Source: The Inside Story: A Guide to Indoor Air Quality, U.S. CPSC/EPA
13. Gas Stoves Increase Indoor NO2 to Levels Exceeding Outdoor Concentrations
Gas stoves and kerosene heaters release nitrogen dioxide (NO2). This gas irritates airways and reduces lung function.
Homes with gas stoves, kerosene heaters, or unvented gas space heaters often show indoor NO2 levels exceeding outdoor concentrations. Young children in these homes face increased risks of respiratory infections and impaired lung development.
Installing and using exhaust fans vented to the outdoors reduces NO2 exposure. Proper AC filter maintenance also helps capture some particulates.
Source: The Inside Story: A Guide to Indoor Air Quality, U.S. CPSC/EPA
14. Certain Pesticides Can Cause Liver and Central Nervous System Damage
Both active and inert ingredients in pesticides add organic compounds to indoor air. These chemicals create both immediate and long-term health risks.
Misapplication of cyclodiene pesticides has caused headaches, dizziness, muscle twitching, weakness, and nausea. EPA concerns include potential long-term liver damage, central nervous system damage, and increased cancer risk from certain pesticides.
Using nonchemical pest control methods when possible reduces indoor pesticide loads. Proper ventilation after any pesticide application remains essential.
Source: The Inside Story: A Guide to Indoor Air Quality, U.S. CPSC/EPA
15. Poor Indoor Air Quality Costs U.S. Economy $168 Billion Per Year
Poor indoor air quality creates economic burdens beyond health care costs. Productivity losses and building damage add to the total impact.
Studies estimate the overall cost to the U.S. economy from poor indoor air quality reaches $168 billion per year. This figure includes:
- Health care expenses
- Productivity losses
- Sick building syndrome impacts
Office workers score higher on performance measures when working in “green” environments with low indoor pollutants and low carbon dioxide levels. Harvard research links indoor air quality directly to cognitive function, including response times and ability to focus.
Sources: Indoor Air Quality, National Institute of Environmental Health Sciences
16. Poor IAQ Reduces Productivity by 3–9%
Indoor air quality directly impacts workplace performance. Clean air boosts cognitive function and reduces errors.
Research published by the National Library of Medicine shows poor indoor air quality can reduce productivity by 3–9%. Contaminants like dust, VOCs, and inadequate ventilation lead to discomfort, fatigue, and increased sick days among employees.
A study in Environmental Health Perspectives revealed that increasing ventilation rates can improve cognitive function scores by up to 101%. This finding highlights how critical clean air is for complex decision-making and operational efficiency.
Source: The Human Impact of Indoor Air Quality, American Air Filter International
17. 30% of New Buildings May Be Associated With Sick Building Syndrome
Sick building syndrome (SBS) occurs when building occupants experience health issues linked to time spent in a building. Symptoms include headaches, fatigue, eye irritation, and respiratory problems.
The EPA estimates that around 30% of new and remodeled buildings worldwide may be associated with symptoms of sick building syndrome. This highlights the importance of proper ventilation, air filtration, and material selection during construction or renovation.
Research shows that improving ventilation systems can decrease SBS symptoms by 40% to 50%. One study found that after workers moved to a building with improved ventilation, symptom prevalence dropped significantly:
- Skin symptoms: 54% reduction
- Respiratory system: 53% reduction
- Nose and throat: 46% reduction
- Fatigue: 44% reduction
Sources: The Human Impact of Indoor Air Quality, American Air Filter International | Prevalence of Sick Building Syndrome Symptoms in Office Workers, Occupational and Environmental Medicine
18. Over 90% of U.S. Homes Have Three or More Detectable Allergens
Indoor allergens trigger asthma and allergy symptoms in millions of Americans. These biological contaminants hide in dust, fabrics, and building materials.
The National Institutes of Health conducted the largest indoor allergen study in U.S. history. Researchers found that over 90% of homes had three or more detectable allergens. Additionally, 73% of homes had at least one allergen at elevated levels.
The study measured eight common allergens: cat, dog, cockroach, mouse, rat, mold, and two types of dust mite allergens. Virtually all homes (>99%) had detectable levels of cat, dog, and mold allergens.
Source: Allergens Widespread in Largest Study of U.S. Homes
19. 45.8% of Homes Have Three Allergens at Elevated Levels
Multiple allergens often coexist in the same living space. This compound exposure increases health risks for sensitive individuals.
The National Survey of Lead and Allergens in Housing found that 45.8% of U.S. homes had at least three allergens exceeding elevated levels. Among atopics (people with allergic sensitivities), high allergen burden increased the odds of having asthma symptoms by 81%.
Pets, mold problems, and smoking significantly increase the likelihood of high allergen burden. Homes with pets showed nearly three times the odds of elevated allergen levels compared to pet-free homes.
Source: Exposure to Multiple Indoor Allergens in US Homes, Journal of Allergy and Clinical Immunology
20. CO2 Levels Above 1,000 PPM Impair Decision-Making Performance
Carbon dioxide serves as an indicator of ventilation quality. High CO2 levels signal poor air exchange and correlate with cognitive decline.
Research shows that decision-making performance significantly declines at 1,000 ppm CO2 compared to 600 ppm. At 1,500 ppm to 2,500 ppm, occupants commonly report:
- Stuffiness
- Headaches
- Fatigue
By 2,500 ppm, measurable performance losses become likely. ASHRAE recommends keeping indoor CO2 below approximately 1,000 ppm for comfort and cognition. Well-ventilated indoor spaces typically run 600–1,000 ppm, while typical outdoor air in 2025 measures around 425 ppm.
Source: How Much CO2 Is Dangerous, Atmotube
21. Wildfire Smoke Nearly Triples Indoor PM2.5 Concentrations
Wildfires have become a major source of particulate matter pollution. Even homes far from burn areas experience degraded indoor air quality.
Research using crowdsourced data from over 1,400 California buildings found that mean indoor PM2.5 concentrations nearly tripled during wildfire events. Even with reduced infiltration ratios, wildfire smoke significantly elevates indoor particle levels.
Buildings with air conditioning and filtration showed lower infiltration rates. Newer buildings also demonstrated better protection against wildfire smoke intrusion.
Source: Wildfire Smoke Impacts on Indoor Air Quality, NOAA, PNAS
22. MERV 13 Filters Achieve 0.12 Indoor/Outdoor PM2.5 Ratio
Filtration efficiency determines how much outdoor pollution enters indoor spaces. Higher-rated filters provide significantly better protection.
A study of 24 campus buildings during wildfire events found that MERV 13 filters achieved indoor/outdoor PM2.5 ratios of 0.12 ± 0.07. In contrast, MERV 8 filters showed ratios of 0.28 ± 0.14. This means MERV 13 filters reduce indoor particle levels by nearly 60% compared to MERV 8.
During wildfire-affected days, 71% of buildings exceeded the Canadian Ambient Air Quality Standards daily limit of 27 μg/m³ for PM2.5. This demonstrates that even advanced filtration may not ensure healthy indoor air during extreme pollution events without additional measures.
Source: Impact of Wildfire Smoke PM2.5 on Indoor Air Quality, ACS ES&T Air
23. Air Purifier Performance Declines 70% in Oily Environments
Air purifiers provide effective particle control, but their performance varies by environment. Cooking fumes and certain household activities accelerate filter degradation.
A 12-month study of air purifiers in residential environments found that clean air delivery rate (CADR) for particulate matter attenuated by 70.6% in oily fume environments after 1,000 hours of operation. In non-oily environments, attenuation was only 19.9%.
Oily particles load onto electret filters and significantly reduce electrostatic attraction. After 12 months, PM2.5 concentrations rose by 92.7% in oily fume environments compared to 76.5% in non-oily environments.
Source: Exploring Long-Term Performance of Air Purifiers, Environmental Research
24. 66% of Americans More Cautious About Indoor Air Since Pandemic
Public awareness of indoor air quality has shifted dramatically. Recent events have made Americans more mindful of what they breathe.
The recent GPS Air Indoor Air Quality Perception Report found that 66% of Americans say they are more cautious about indoor air since the pandemic. Additionally, 70% report that wildfires, pollution, and other recent events have made them more mindful of indoor air quality.
Trust breaks down in public spaces. Over half (56%) trust the air in their homes more than in shared spaces like gyms or stores. Only 9% think public spaces have better air systems than their own homes.
Source: GPS Air Indoor Air Quality Perception Report, GPS Air
25. 41% Say Bad Odors Are Bigger Red Flag Than Virus Outbreak
Americans rely on sensory cues to judge air quality. Smell has become a primary indicator of perceived safety.
According to the recent GPS Air survey, 41% of Americans say unpleasant odors would keep them from returning to a gym, store, or office. This exceeds the 34% who say the same about a known virus outbreak.
Smell serves as a dealbreaker for customer retention. Businesses that ignore odor control risk losing nearly half their potential repeat customers.
Source: GPS Air Indoor Air Quality Perception Report, GPS Air
26. 61% Want Public Air Quality Monitoring
Transparency builds trust. Americans increasingly demand visible proof of clean air.
The GPS Air survey found that 61% of Americans would trust a space more if they knew it monitored indoor air quality. Nearly two-thirds (65%) believe businesses should publicly display air scores like health ratings.
Schools and airports face particular pressure:
- 77% want mandatory air quality testing and reporting in schools
- 78% say visible clean-air efforts would make them more comfortable in airports
Source: GPS Air Indoor Air Quality Perception Report, GPS Air
27. 80% Consider Air Quality Ratings for Travel Decisions
Air quality influences consumer behavior beyond health concerns. It now factors into leisure and business decisions.
The GPS Air survey revealed that 80% of Americans would consider air quality ratings when making travel or event decisions. 21% say those scores would be a major factor in their choice.
Clean air earns business loyalty:
- 66% would switch gyms for better air filtration even if it costs more
- Over half (52%) would pick a hotel with cleaner air over one at the same price
Source: GPS Air Indoor Air Quality Perception Report, GPS Air
What These Indoor Air Quality Statistics Mean for Your Home
The data reveals clear priorities for homeowners. Focus on the pollutants posing the greatest risks in your specific environment.
Immediate action steps:
- Test for radon every two years
- Install carbon monoxide detectors on every level
- Maintain humidity between 30-50%
- Ventilate properly when using cleaning products, paints, or pesticides
- Consider air purification systems with HEPA and activated carbon filtration
- Upgrade to MERV 13 filters for better particle capture
- Monitor CO2 levels to ensure adequate ventilation
- Address moisture issues promptly to prevent mold growth
The team at Salas HVAC helps Arizona families measure and interpret air quality data and implement indoor air quality solutions. Statistics only makes a difference when they drive action.
FAQs
How do I know if my indoor air quality is bad?
Watch for symptoms like headaches, fatigue, dizziness, coughing, sneezing, or eye irritation that improve when you leave home. Musty odors, visible mold, or excessive dust also signal problems. Professional testing measures specific pollutant levels.
What is the most dangerous indoor air pollutant?
Radon ranks as the most dangerous because it causes cancer without producing any immediate symptoms. Carbon monoxide poses the most immediate lethal threat. Both require specific detection methods since you cannot see or smell them.
How often should I test my indoor air quality?
Test for radon every two years or after any home renovation. Check carbon monoxide detector batteries monthly and replace units every 5-7 years. Schedule professional HVAC inspections annually to identify combustion-related risks.
Can plants improve indoor air quality?
Plants provide minimal air purification at practical indoor densities. Research shows you would need hundreds of plants per room to match the effectiveness of mechanical filtration. Focus on source control and ventilation first.
Does opening windows improve indoor air quality?
Opening windows increases ventilation and reduces indoor pollutant concentrations. However, outdoor air quality matters. Check local air quality indexes before opening windows during high pollution days or pollen seasons.
What MERV rating should I use for wildfire smoke?
Use at least MERV 13 filters during wildfire events. These filters achieve indoor/outdoor PM2.5 ratios of approximately 0.12 compared to 0.28 for MERV 8 filters.
Breathe easy,
Michael