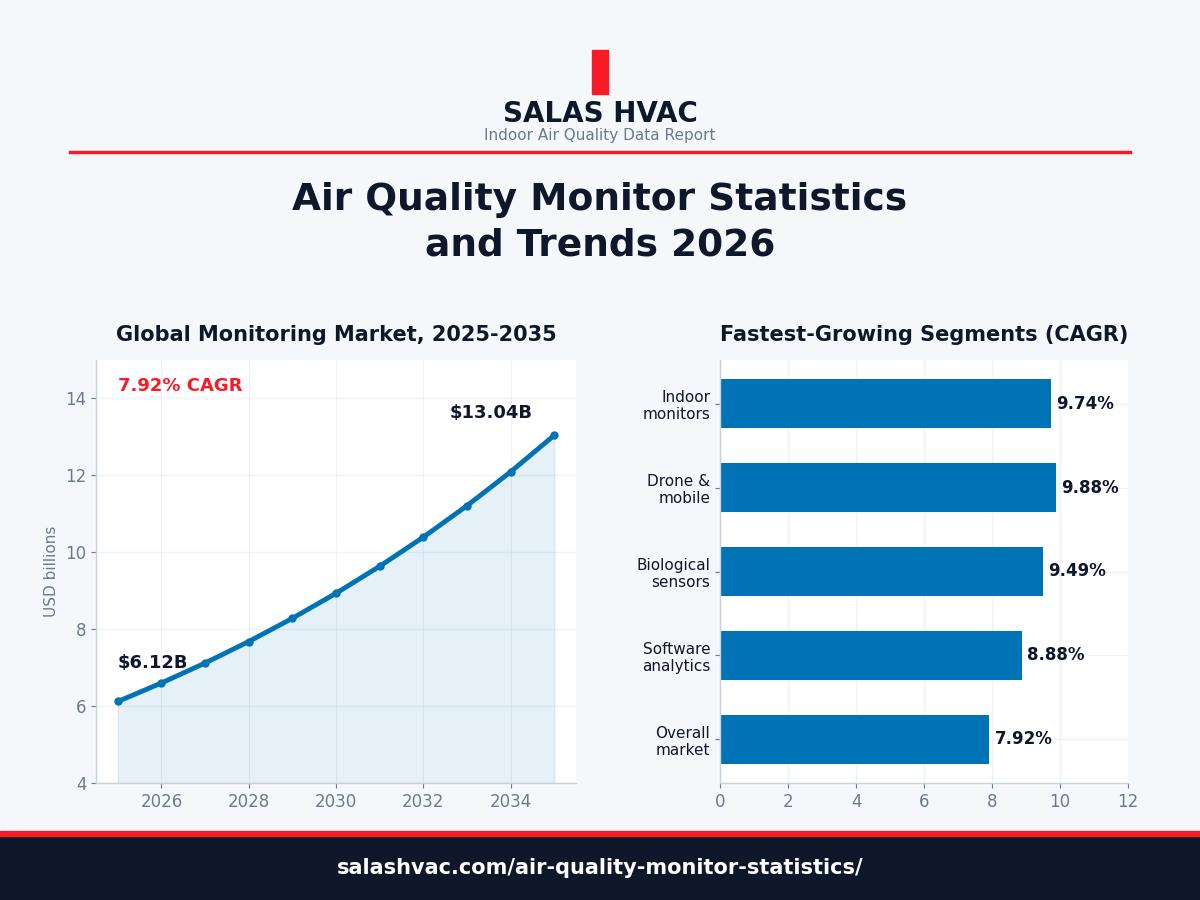
Air quality monitor statistics tell a clear growth story: The global air quality monitoring market is expected to reach $6.57 billion in 2026, on its way to $13.04 billion by 2035 at a 7.92% annual growth rate.
The US EPA tightened its annual PM2.5 standard to 9 micrograms per cubic meter in early 2024, and the EU’s revised Ambient Air Quality Directive demands real-time public data portals across all member states by 2028. Together, these rules turned air quality monitoring from a nice-to-have into a compliance purchase.
We install and service indoor air quality systems for a living, so we added our field observations where the data meets practical air quality services.
Scroll down to find the latest numbers on market size, sensor technology, indoor monitoring growth, and what these trends mean for your home or building.
Air Quality Monitor Statistics at a Glance
Short on time? These are the numbers that define the market in 2026.
- $6.12 billion: global air quality monitoring market size in 2025, growing to $13.04 billion by 2035.
- 9.74%: annual growth rate of indoor monitors, the fastest-growing product type in the market.
- 52.3%: the market share of particulate matter monitoring, the dominant pollutant category.
- 58%: the revenue share outdoor monitors still hold over indoor units.
- 9 micrograms per cubic meter: the EPA’s tightened annual PM2.5 standard, set in 2024, that accelerated monitor purchases.
- 38%: Asia-Pacific’s share of the global market, the largest regional bloc.
How Big Is the Air Quality Monitoring Market?
The air quality monitoring market is worth between $5.73 and $6.12 billion in 2025, depending on the research firm. Growth runs at 7.3% to 7.9% per year.
Forecasts put the market between $8.77 billion by 2031 and $13.04 billion by 2035.
Why the range? Analysts count different product categories.
Mordor Intelligence values the market at $5.73 billion for 2025, growing at 7.35% annually to reach $8.77 billion by 2031.
Market Research Future uses a broader definition and lands at $6.12 billion for 2025, with a 7.92% CAGR through 2035.
Most research firms agree on the direction: steady, regulation-backed growth with no sign of slowing.
These figures come from MRFR’s 2026 report:
| Metric | 2025 Value | Forecast | CAGR |
|---|---|---|---|
| Global market (MRFR) | $6.12 billion | $13.04 billion by 2035 | 7.92% |
| Global market (Mordor) | $5.73 billion | $8.77 billion by 2031 | 7.35% |
| Hardware share | 52.9% | Software growing faster | 8.88% (software) |
| Outdoor monitors | 58.0% share | Stable | Baseline |
| Indoor monitors | Smaller share | Fastest product growth | 9.74% |
Why Air Quality Monitor Demand Is Surging
Four forces push monitor adoption in 2026, and each one shows up in the sales data.
1. Stricter Government Standards
The EPA’s 2024 PM2.5 rule forces daily AQI updates for every US metro area above 350,000 residents. Europe followed with its own directive requiring member states to publish real-time air data by 2028.
When governments must measure, they buy monitors. Government and municipal buyers account for 28% of the market, and compliance deadlines keep that demand stable even when consumer spending dips.
2. The Indoor Air Quality Push
Americans spend about 90% of their time indoors, where pollutant concentrations often run 2 to 5 times higher than outdoor levels.
That single EPA fact reshaped consumer behavior. Indoor monitors now post the fastest product-level growth in the entire market at 9.74% CAGR through 2035. Our indoor air quality statistics roundup tracks the health data behind this shift.
3. Green Building Certifications
WELL and LEED certifications now require continuous particulate and CO2 monitoring in occupied commercial spaces.
ASHRAE Standard 241 added infection-risk ventilation requirements. Building owners who want certification must install monitors, period.
4. Corporate ESG Reporting
The EU’s Corporate Sustainability Reporting Directive pushes companies to quantify indoor environmental quality as part of employee wellness disclosures.
Insurance underwriters and real estate platforms also buy aggregated air data now. That created an entirely new revenue category: environmental intelligence services.
Air Quality Monitor Statistics by Segment
The market splits cleanly across five dimensions. Here is where the money sits:
Product Type: Outdoor Still Leads, Indoor Catches Up
Outdoor monitors captured 58% of 2025 revenue because regulatory ambient stations cost far more than consumer devices. Fixed monitoring stations alone hold 59.7% of the market.
Indoor units grow nearly twice as fast as the overall market. Expect that gap to keep closing as home sensors get cheaper and commercial codes get stricter.
For homeowners, this shift is the practical story: the same sensing technology that regulators require in public buildings now ships in a $200 device on your nightstand.
Pollutant Parameters: Particles Dominate
- Particulate matter (PM2.5/PM10): 52.3% of the market, the largest parameter segment.
- Chemical and gaseous pollutants: $1.89 billion in 2025, tied to industrial compliance.
- Biological pollutants: the fastest riser at 9.49% CAGR, thanks to post-pandemic bioaerosol surveillance.
Curious about the invisible chemicals floating around your living room? Our guide on where VOCs hide at home pairs well with a monitor that tracks them.
Technology: Lasers Gain on Gas Analyzers
Gas analyzers still hold 47.7% of revenue for regulatory compliance work. Spectroscopic and laser-based sensors post the strongest technology growth at 7.91% CAGR because they detect multiple pollutants from one housing.
Electrochemical sensors fill the budget end at $0.82 billion. These power most sub-$300 consumer monitors.
End Users: Buildings Beat Government
Residential and commercial buildings represent 37% of the market, the largest end-user group. Government follows at 28%, and industrial users grow fastest at 8.4% CAGR.
Geography: Asia-Pacific Leads
Asia-Pacific holds 38% of the global market. China and India together operate more than 12,000 continuous monitoring stations. North America accounts for 27%, and Europe holds 22%.
Within the US, air quality varies wildly by region. Our data on the worst states for air quality shows exactly where monitors earn their keep fastest.
How Monitors Connect to Purifiers and HVAC Systems
The most useful monitor is the one that triggers action automatically. Smart purifiers with onboard particle sensors already adjust fan speed on their own, and that automation is a core reason the smart segment grows at double-digit rates.
Standalone monitors take this further. A good unit can trigger whole-home ventilation, adjust a smart thermostat’s fan schedule, or alert your phone when CO2 climbs past 1,000 ppm.
Commercial buildings have worked this way for years under WELL certification rules, and the same integrations now ship in consumer ecosystems.
One placement note from our installs: monitors near supply vents or windows report the weather, not your room.
Mount the unit at breathing height, at least three feet from vents, doors, and direct sunlight, and let it run for a week before you judge any readings.
Consumer Air Quality Monitors: What the Data Means for You
Market statistics tell you the industry is booming. Here is what matters when you buy one for your home.
Accuracy tiers exist. Regulatory stations use Federal Equivalent Method certified instruments that cost thousands. Consumer monitors under $300 use laser particle counters and electrochemical cells. They give indicative readings, not legal-grade data.
That is fine for home use. You do not need lab precision to know your bedroom PM2.5 spiked while cooking. You need trend visibility: is the air getting better or worse, and did your purifier fix it?
CO2 is the sleeper metric. Commercial buildings adopted CO2 monitoring first because it tracks ventilation quality. Home buyers followed. A CO2 reading above 1,000 ppm tells you to bring in fresh air, something we check on every indoor air quality service call.
Pair measurement with action. A monitor without a response plan is a smoke alarm with no batteries. If your readings stay high, test systematically. Our walkthrough on testing for VOCs at home shows the exact sequence we use.
What Consumer Monitors Cost
Entry-level particle counters start around $60 and track PM2.5 only. Mid-range units from $150 to $250 add VOC and CO2 sensing with app connectivity. Prosumer models above $300 approach the accuracy of instruments that building inspectors use.
Our advice after installing hundreds of sensors: buy for the pollutant you actually worry about. Wildfire smoke concerns need PM2.5 accuracy. Stuffy-room complaints need CO2. New renovation worries need VOC detection.
Wearables and Personal Exposure Sensors
The newest consumer category clips monitoring to your body. Personal exposure sensors track the air in your breathing zone as you move through your day, and research teams use them to study how commute routes and buildings change individual exposure.
Consumer versions remain early and pricey, but the technology follows the same cost curve as fitness trackers. Expect capable personal monitors under $100 within a few product cycles.
For now, a well-placed stationary monitor gives most families better data per dollar than a wearable does.
Sensor Lifespan and Calibration
Laser particle sensors typically last three to five years before drift degrades accuracy. Electrochemical gas cells degrade faster, often within two to three years. Budget for replacement or recalibration when you compare monitor prices.
This is where cheap monitors cost more than they save. A $50 sensor that drifts in 18 months tells you worse information than no sensor at all.
Regulatory stations handle this problem with scheduled calibration against reference instruments.
Consumer monitors cannot match that rigor, so the practical move is a yearly sanity check.
Compare your unit against the nearest official AQI station on a clean day and a smoky day, and replace the sensor when readings stop tracking together.
Air Quality Monitoring Trends for 2026 and Beyond
Three trends will define the next five years of this market.
Drone and mobile monitoring is the fastest-growing deployment mode at 9.88% CAGR. Wildfire response teams, oil and gas operators, and city agencies now map pollution in three dimensions.
Software outgrows hardware. Hardware holds 52.9% of revenue, but cloud analytics platforms grow at 8.88% annually. The money is shifting from measuring air to interpreting it.
Low-cost sensor networks will blanket cities. Battery-powered mini-stations on lampposts already gather snapshots where 24/7 power is impractical. Expect hyperlocal AQI maps to become as normal as weather apps by 2030.
FAQs
How big is the air quality monitoring market in 2026?
The global air quality monitoring market is worth about $6.15 to $6.57 billion in 2026, depending on the research firm. Forecasts project $8.77 billion by 2031 and up to $13.04 billion by 2035, with annual growth between 7.35% and 7.92%.
Are home air quality monitors accurate?
Consumer monitors under $300 give indicative readings, not regulatory-grade data. They reliably show trends and spikes, which is what most homeowners need. They do not meet Federal Equivalent Method certification standards that government stations require.
What is the fastest-growing segment of air quality monitoring?
Indoor monitors lead product growth at 9.74% CAGR through 2035. Drone-mounted platforms lead deployment growth at 9.88%. Biological pollutant detection leads parameter growth at 9.49% as post-pandemic bioaerosol surveillance expands.
Why did air quality monitoring demand spike after 2024?
The EPA lowered its annual PM2.5 standard to 9 micrograms per cubic meter in 2024, forcing expanded monitoring across US metros. The EU followed with real-time public data mandates by 2028. Both moves converted discretionary purchases into compliance buying.
How many air quality monitors does a home need?
One per main living zone is enough for most homes. Put the first unit where your family spends the most hours, usually the bedroom or living room. Add a second in the kitchen if cooking fumes are a concern, since cooking is the biggest indoor particle source in most homes.
Sources
- Market Research Future. “Air Quality Monitoring Market Report 2026-2035.” August 2026. https://www.marketresearchfuture.com/reports/air-quality-monitoring-market-8859
- Mordor Intelligence. “Air Quality Monitoring Market Size and Share Analysis.” August 2026. https://www.mordorintelligence.com/industry-reports/air-quality-monitoring-market
- US Environmental Protection Agency. “Indoor Air Quality: Report on the Environment.” May 2026. https://www.epa.gov/report-environment/indoor-air-quality